
Why is Greater Manchester the fastest growing part of the country?
Finding answers to the productivity puzzle


Greater Manchester (GM) has been the fastest growing part of the country in recent years - and this is a topic that merits further investigation.1
It has been given this crown based on analysis of GM’s growth in something called Gross Value Added (GVA) per hour worked. This is a measure of productivity - roughly how much value did the economy (GVA) get for the amount of time put in (hours worked).
Could the economy be growing based on the construction seen in the centre - or are other sectors like manufacturing or tech driving it forward? And what about others parts of the country that have grown strongly? Given this country’s lacklustre growth over the past couple of decades, perhaps there is something to learn from looking at the places which have bucked this trend.
So I’ve looked into the statistics in the hope that I’d find something which says ‘here is the answer to economic growth’ in the UK. Instead, I found a puzzle - or a series of puzzles - that need further work.
This post starts by looking at the sectors of the economy which have grown in Greater Manchester, before looking at other areas in England and trying to draw some very limited conclusions.
Most importantly, I hope this work generates a bit of optimism that we can grow our economy in the right conditions and sparks off others to look into this trend and build on - or critique - the very limited work here. So it would be great to hear from others with analysis or data on this topic.
Growth in Greater Manchester
In terms of sectors, the largest GVA growth in absolute and percentage terms has come in ‘Information and technology’ and in ‘Professional, scientific and technical activities’. 2
Together they are responsible for about a third of GM’s total GVA growth since 2015. In the chart below I’ve added the GVA growth for the third largest growing industry - education - as well as the all industry average for comparison. Just to be totally clear - this shows total growth in output (GVA) not in productivity - indexed to 2015 levels.
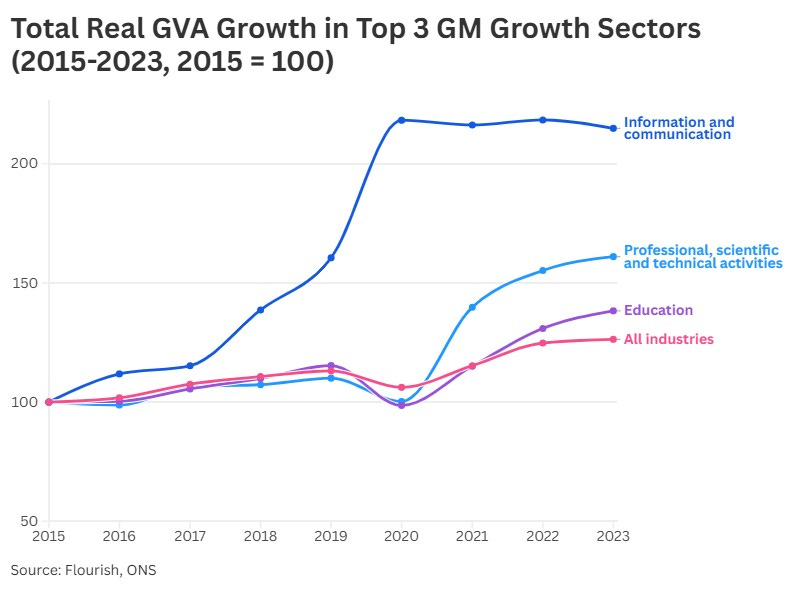
I decided to look further at the information and communication sector given its outsized role. As set out in footnote 2, it comprises sub-sectors including media, publishing, broadcasting and computer programming - the digital, technological and cultural heart of much of the modern economy. In GVA terms it has grown by 115% since 2015 as shown in the chart above. But really what we care about here is productivity.
Annoyingly, for data reasons, I don’t think we can do the exact same calculations in terms of GVA per hour worked by sector, but we can look at total GVA growth by sector, employment by sector and use the two to construct a ‘GVA per employment’ metric as a proxy for productivity if needed.
Driven by data availability only going back to 2015, I’ve had to use the range 2015 to 2023 for this analysis. Doing this allows us to see that the number of jobs in information and communication increased by about 33% over this time period. And this implies a 62% increase in GVA per employment over 2015 to 2023.
This is strong - but then I wondered how it compared to other places. Over the period 2015 to 2023 the highest GVA growth across the UK in these sectors has actually been in Cornwall and Isles of Scilly, South Yorkshire and Tees Valley. All of these areas saw GVA growth in information and communication above 150% compared to GM’s 115%.
So whilst this sector is important - I figured it couldn’t be the whole answer.
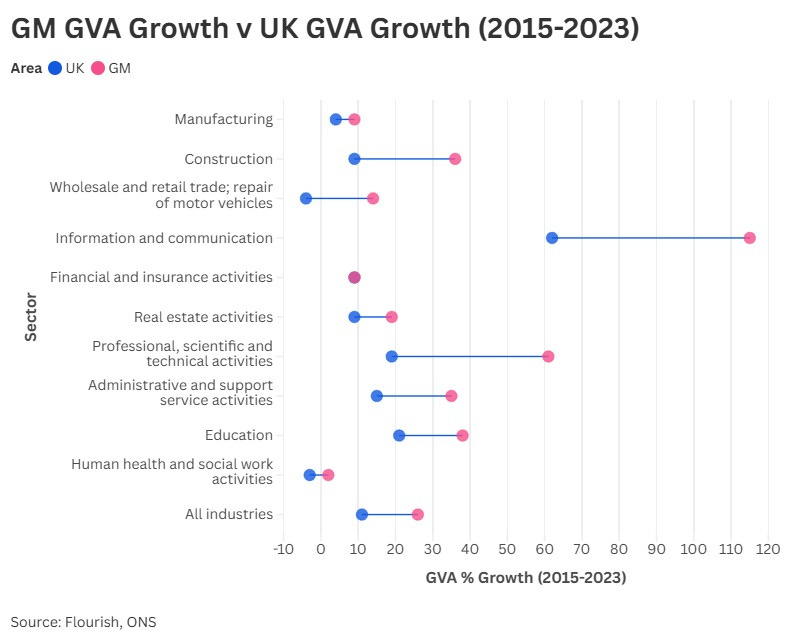
So I then looked at GVA growth across all sectors and compared it to the UK average growth in those sectors. Now I thought this was interesting.
GM GVA growth has been above the average for UK GVA growth in almost every sector - often substantially. I took the 10 largest sectors in GM to show this trend in the chart below. These top 10 sectors are worth at least £4.5bn each to the GM economy. Every single one of them has had higher GVA growth than the national average.
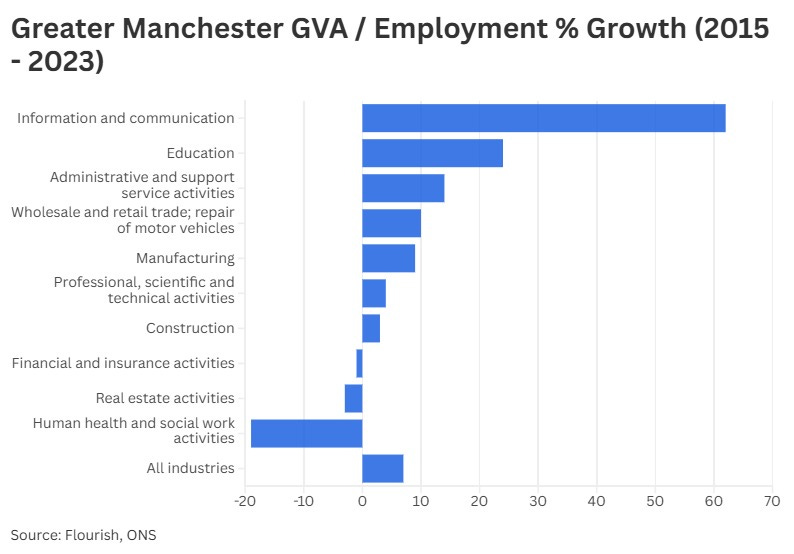
But what about productivity in each sector? Looking again at the top 10 sectors, we can see that our proxy measure of productivity (GVA/employment) has grown in most of the top sectors - though the health sector has been weak (presumably owing to the after effects of the pandemic as has been widely reported).
What does this tell us?
GM growth has been broad across sectors but particularly concentrated in key sectors you would expect a modern services orientated city to specialise in.
But then I started to wonder more about other places…
Growth in other areas
What I really wanted to look at was which sub-regional areas of England had also had the most productivity growth and why.3
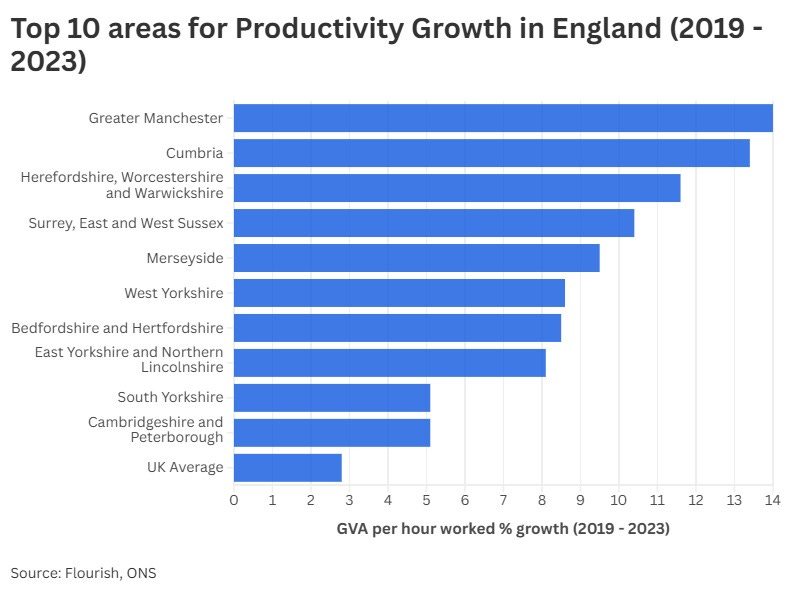
Now there are different ways you can cut this of course, but I thought potentially the most interesting and relevant was looking at the annualised growth rate since 2019 as a proxy for recovery after the pandemic. The top 10 areas and their total productivity growth from 2019 to 2023 are shown below compared to the UK average.
These 10 areas are shown in the map below with further detail in the table.
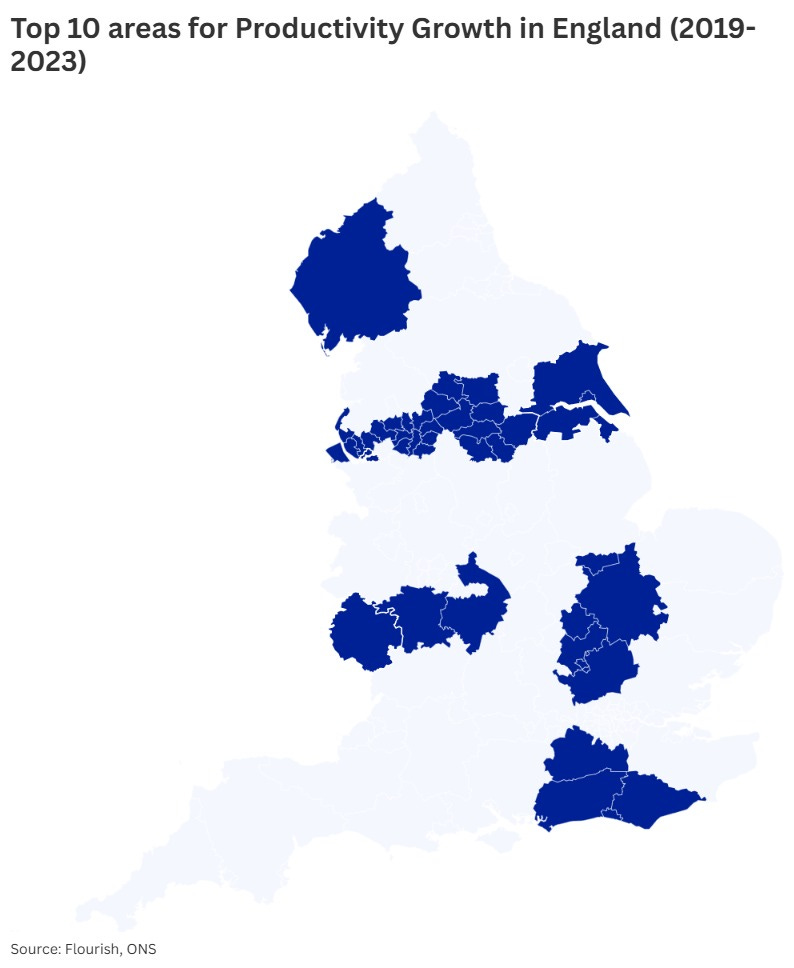
Listed below are these areas ranked in order of the growth from 2019 to 2023. I’ve also included the annualised productivity growth figures (GVA per hour worked - the ideal measure) since 2004 (the earliest the data goes) and since 2013 for interest (given that a decade is a rough good frame of reference). I’ve converted all the growth rates to annualised numbers to allow comparability across the time periods.
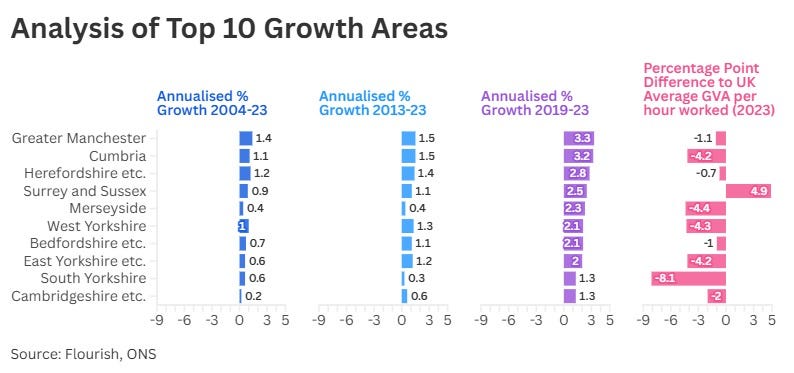
Four things stand out for me from the map and data above:
There is no clear geographic pattern that you could say brings all these areas together - though five of the ten form a belt across the North and three are in areas surrounding London
Productivity improvements are accelerating in Greater Manchester and many of these areas
All but one of these areas is below average for UK productivity, suggesting some element of catchup
Five out of the ten have mayoral devolution, of which four have the highest tier of ‘established status’ with the power and money that confers
I then started to wonder about sectors and realised I could also do the same analysis for each of these areas as I already had for GM. For each of the top 10, I have listed below the top 3 sectors in terms of their percentage growth in GVA (where they are worth more than around 1% of the GVA in the area). 4
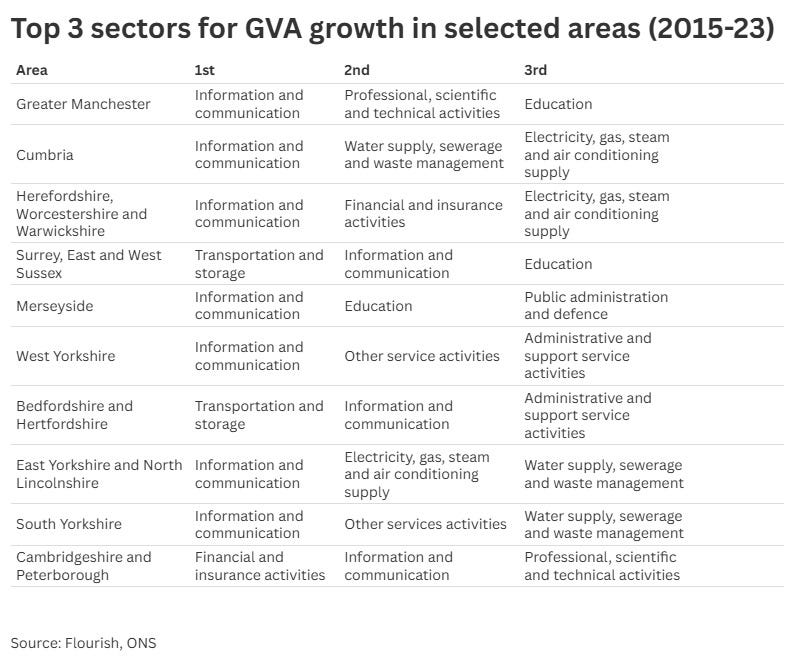
If I were to make some very generalised assumptions from the data above it would be as follows.
Information and communication is a key sector for growth in all ten of these areas. Three of the areas around London may have benefitted from the displacement of activity from the capital following the pandemic and as housing costs become a constraint there? Four of the areas with the deepest devolution might be starting to see the benefits of that devolution (and also happen to be next to each other in the North of England - some spillovers?). Two of the areas - Cumbria and the Humber area - have a big focus on clean energy which seems to be reflected in their growth sectors.
Conclusions - and the need for more analysis
What do I think are some tentative conclusions from this high level analysis?
Growth in GM has been broadly based across sectors - indicating broadly based reasons for it? This could support the idea that things like new transport links, new institutions through devolution etc. are making a difference
Productivity growth has been strongest in modern service sectors - these are the sectors most likely to benefit from agglomeration impacts?
Strong growth has been seen in some other parts of England that have been the focus of recent efforts to devolve powers and also in areas that are behind the average
There is some geographic clustering of the growth in the North and the areas around London
Information and communication is a key driver of growth in all these areas
Obviously more work is needed - not just from me but from a whole industry of analysts. I think there are a series of puzzles around what is driving growth in these areas - and also why London, despite still having the highest productivity, is not seeing the growth that it used to.
With more time, I’d also like to be looking more into subregional productivity by sector over time and bringing in other data to see try to see what is going on. I might get round to this if no-one else has or does soon. I am very interested in what other people think of the data or if there is any other analysis of these trends to look at - let me know via reply or in the comments. Please also let me know if you think any of my analysis looks wrong.
But overall I think there are reasons to be positive from this data, particularly for the North.
We are seeing a surge of growth in different industries. Areas of the country which are mostly behind are catching up - even if slowly. Modern sectors of the economy - and clean energy sectors - seem to be part of the mix. Six out of the top ten areas in the country for productivity growth recovery since the pandemic are in the North.
If the country is looking for growth - then perhaps there is something it can learn from Greater Manchester and these other areas.
If you haven’t already I’d really recommend reading this excellent piece by my former colleague James Gilmour and looking at this analysis by Andrew McPhillips of the Northern Powerhouse Partnership.
All the analysis here draws on ONS data for GVA by area and employment by area. The ONS subsectors included in full are ‘Information and communication’ which is comprised of Publishing activities; Motion picture, video and TV programme production; Programming and broadcasting activities; Telecommunications; Computer programming and consultancy; Information service activities. Professional, scientific and technical activities is comprised of Legal and accounting activities; Head offices and management consultancy; Architectural and engineering activities; Scientific research and development; Advertising and market research; Other professional, scientific and technical activities; Veterinary activities.
Subregional here is jargon for ‘areas the ONS considers equivalent to Greater Manchester when dividing the country up into units’ - many of which are now co-terminous with strategic authority areas. Also called ITL2 in data speak. I’ve also limited myself to England so as to avoid needing to explain devolution or policies in other parts of the UK.
I’ve used 2015-2023 for this table to have same time period as for GM analysis at the top (even though these are the areas that I selected based on their 2019-2023 productivity growth).
You're likely already aware of and linked to this group - but in case not, have a look at the data available through Leeds based Data City
https://thedatacity.com/?utm_term=the%20data%20city&utm_campaign=Brand&utm_source=adwords&utm_medium=ppc&hsa_acc=6512765314&hsa_cam=21928267168&hsa_grp=173745321994&hsa_ad=721981922320&hsa_src=g&hsa_tgt=kwd-2080341736073&hsa_kw=the%20data%20city&hsa_mt=e&hsa_net=adwords&hsa_ver=3&gad_source=1&gad_campaignid=21928267168&gclid=Cj0KCQjwzt_FBhCEARIsAJGFWVlpsofRWMC4vIhPgQyBeS_VR_vNFNIJ19Ap8VyIw0tKmKpJ7dNaTzYaAki5EALw_wcB